Thermal History is Important!
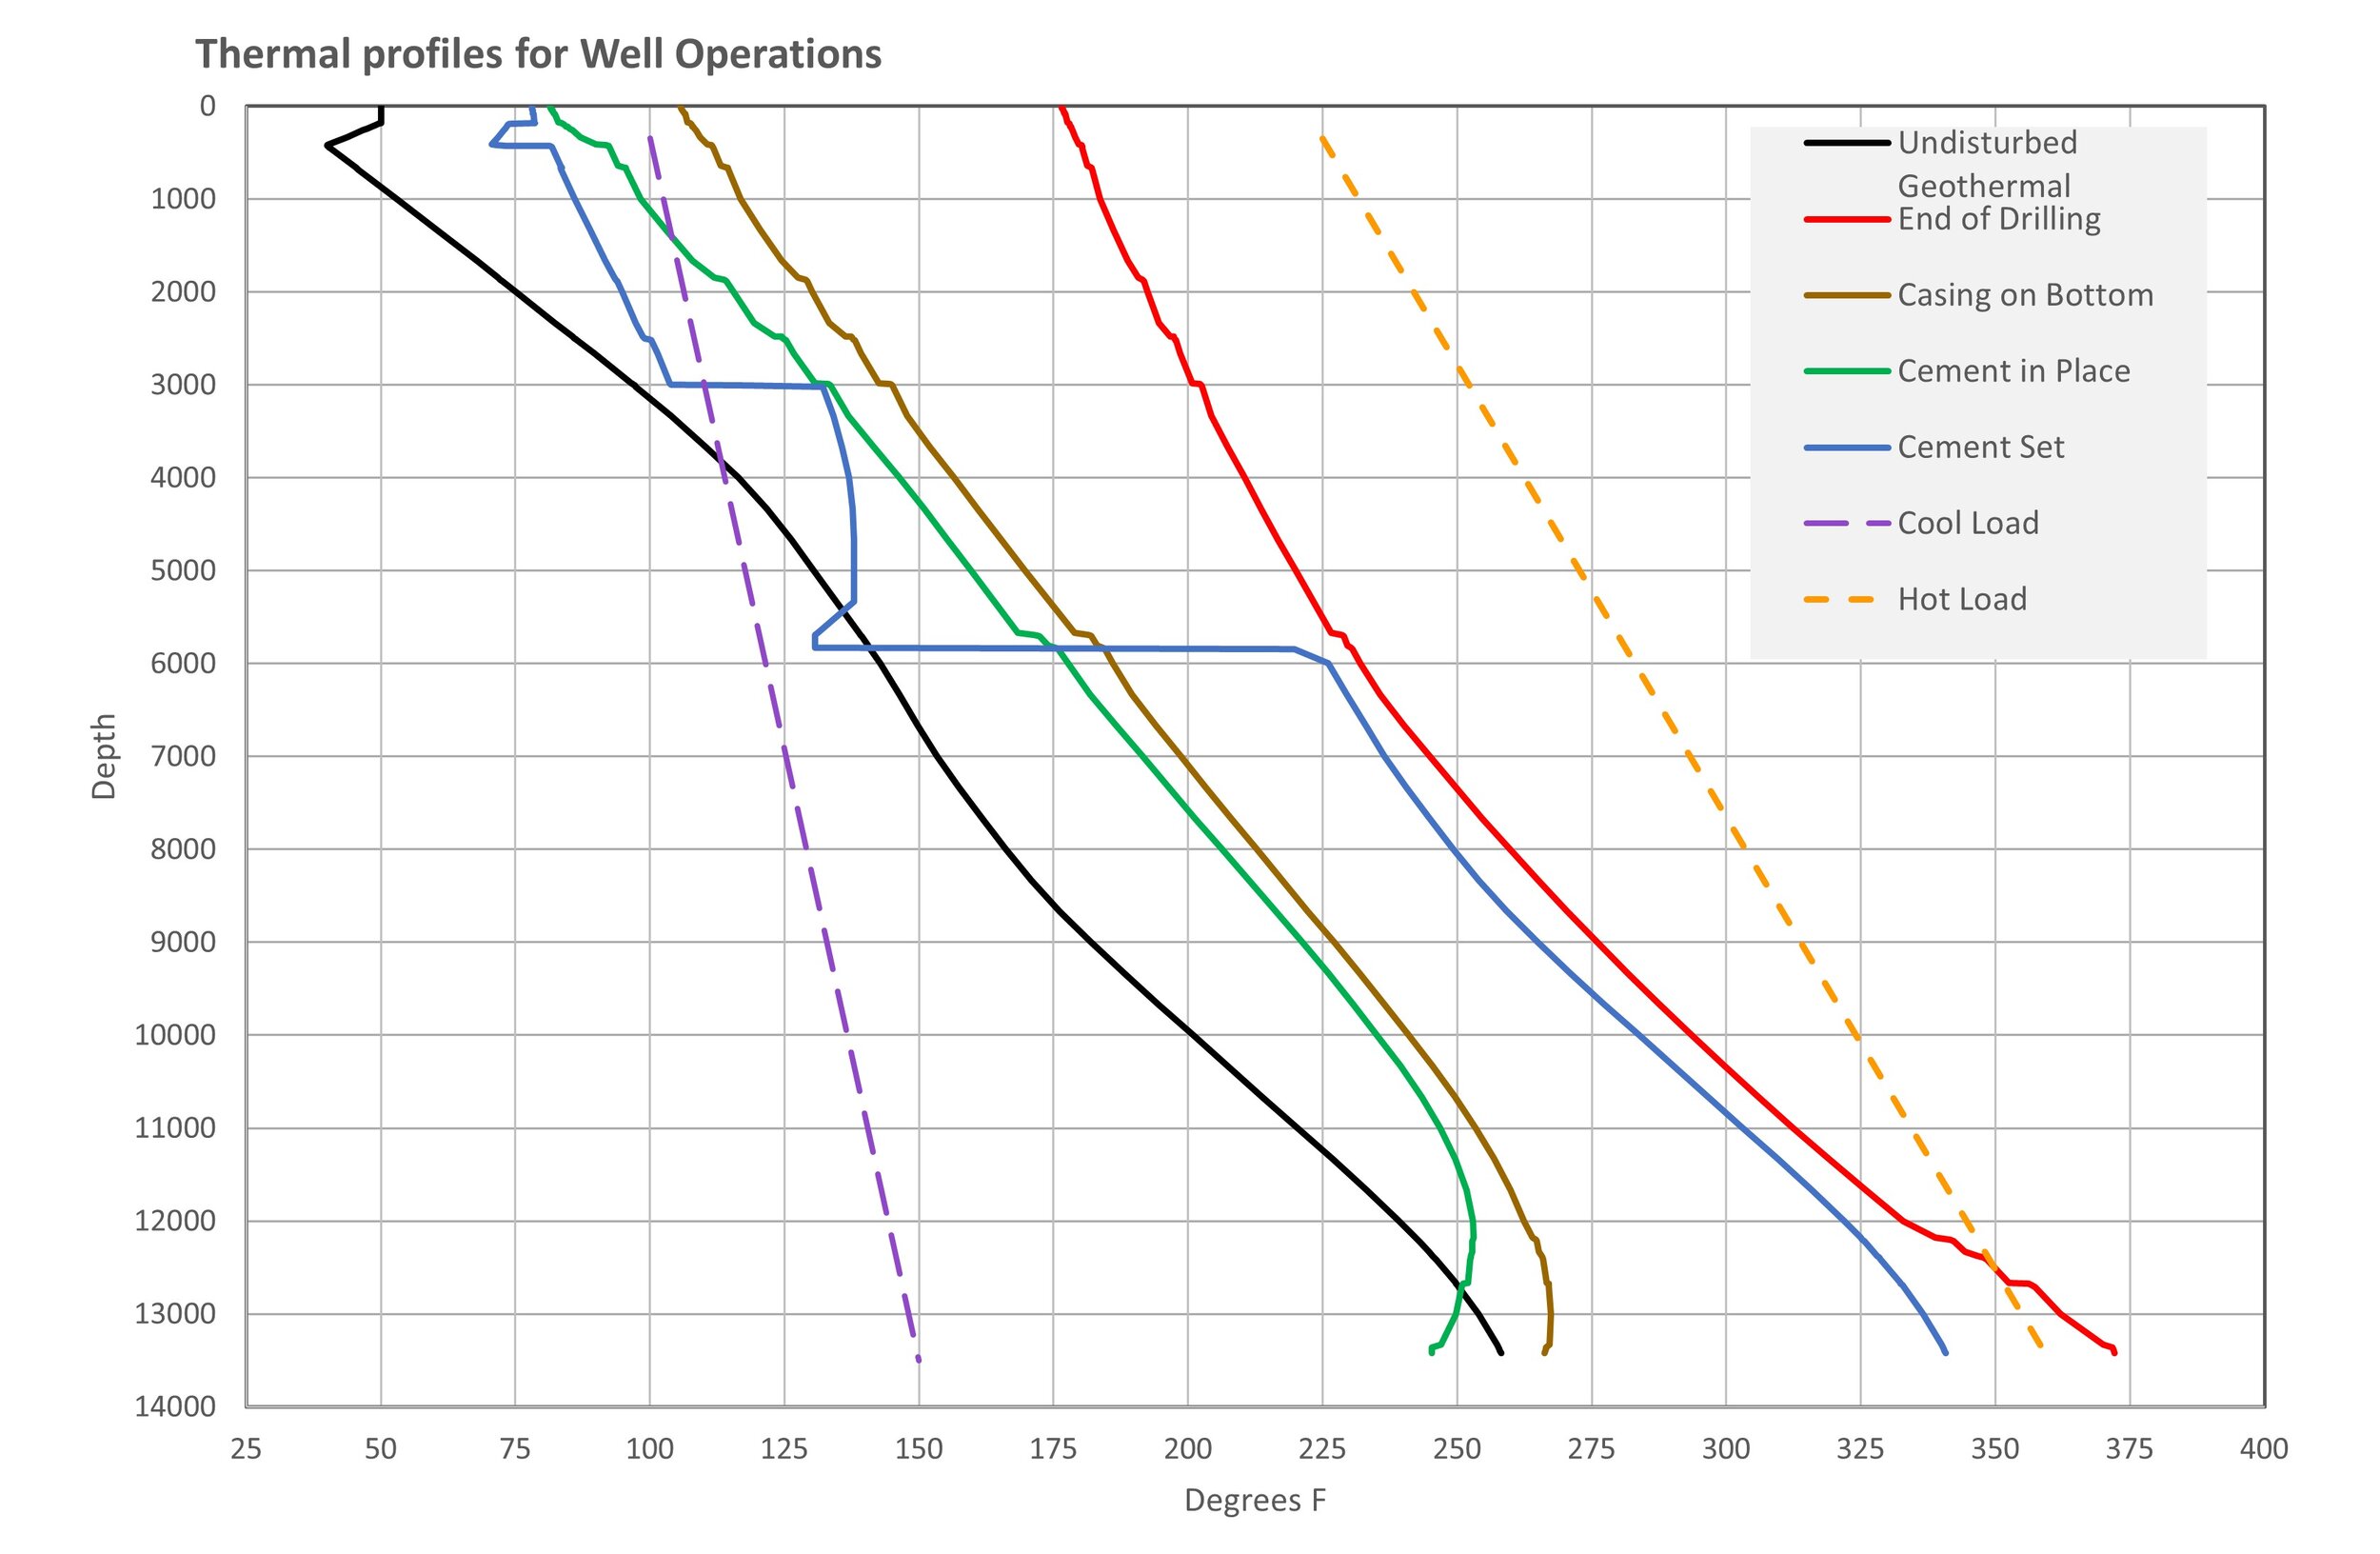
Take a quick look at the graphic. The black line known as the Undisturbed Geothermal Temperature Profile (or UDT) is the starting point and it is not linear, as many might assume. Many UDT profiles have more pronounced curvature than the example above. As the wellbore is drilled through the formation and the drill bit passes a depth for the first time, the wellbore temperature changes and it will not look like the original UDT profile again until the well is shut in for at least 100 days or more. Some wells may not resume the UDT for over 1000 days.
Just as the wellbore is drilled to the depth (~13,500 ft), the resulting temperature profile is shown by the red line. This profile is 90 to 150 degrees F hotter than the UDT and it is also non-linear. Variations in wellbore geometry or thermal property contrasts in the formation layers can cause this profile to be very non-linear.
From the brown line, we can see that during a long time-period without circulation while the casing is being run, the wellbore profile has cooled back about halfway to the UDT, and the bottom is nearly back to its original temperature.
When cement is pumped (using surface temperature mix water), the green line shows that the wellbore is further cooled with the temperature profile nearly linear; however, near the bottom the well has been cooled below UDT.
But as the cement sets, the blue line shows that heat has been released due to the chemical reaction of the setting cement. This is known as the Heat of Hydration (or HoH). The bottom stage of the cement (top at ~5900 ft) and the top (first) stage (top ~3000 ft) are significantly warmed by the HoH. The curve is obviously VERY non-linear. The setting of cement traps not only weight-caused axial stresses but also thermally-induced stresses in the casing. This is called the Initial Condition (or IC).
When performing stress analysis, one must look at the differences between the IC and the ‘final’ temperatures imposed by the assumed loads.
Now – pause for a minute and consider what would happen if one assumed the (black line) UDT instead of the (blue line) IC as the starting point for stress computation? If the imposed temperature profile is ‘cool’ like the dashed violet line, the bottom of the well would be cooled and the top somewhat warmed. Considerable imposed tensile stress due to the cooling in the lower part of the well would be ‘missed’ if the UDT was chosen as the starting point. On the other hand, for a hot load like the dashed orange line, considerable compressive stress in the lower portion of the well would be ‘overstated’ if UDT was assumed as the starting point. Had the IC curve fallen below the UDT curve up shallow in the well, then compressive stresses due to heating would be ‘missed’ if the UDT was chosen as the starting point. A natural consequence of these comparisons is that calculated stresses using the UDT curve as the starting point could possibly yield wrong (and at times significantly wrong) results.
NOTE that the correct starting point or Initial Condition for computing the casing stresses due to loading cannot be predicted without tracking the thermal history of the wellbore profile from the start of drilling.
Be sure to read the next technical point - this is not yet the complete answer!